- On Student Success
- Posts
- Student Success Charts
Student Success Charts
Students and the worlds they inhabit are changing—but we are not keeping pace.
Glenda Morgan
March 26, 2026

As always, a pattern runs through this month’s charts. Student behaviors and needs are changing. Markets are changing. But the way we design and measure student success is not keeping up.
Students Are Not Who We Think They Are
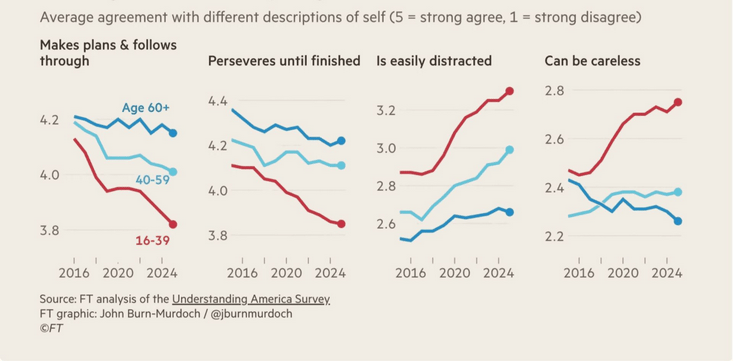
I keep turning this chart from John Burn-Murdoch over in my head. It would be easy to dismiss this as a story about youth. But even at the upper end of that range, these are not just “young people.”
The shift is clear: younger adults report lower levels of persistence and follow-through, and higher levels of distraction and carelessness. That has direct implications for how students navigate college and what it takes to succeed.
According to Brandon Busteed, demand for internships is rising sharply even as supply is falling.

Adapted from Brandon Busteed
These are not small shifts. They fundamentally change what it takes for students to succeed and quietly invalidate many of the assumptions built into our advising models, course structures, and support systems.
And even if students themselves were not changing, the environment they are entering would still make success harder.
The Ground Is Shifting Beneath Them
The world our students are entering is becoming more competitive, more constrained, and more uneven. Some of this is good, much of it is not. But all of these changes create challenges.
Ranking institutions is, at best, an imperfect science. But the improvement in STEM rankings by Asian institutions over the past decade is striking.

Another great graphic from John Burn-Murdoch (anyone else want to join me in the fan club?).
If these numbers hold, this does not augur well for the affordability of higher education institutions in London in the future.

Seen this way, the outlook for UK higher education is increasingly fragile.

In the US, some institutions are doing better than others at enrollment. For many this is not news, but this graphic from Stevens Strategy is striking

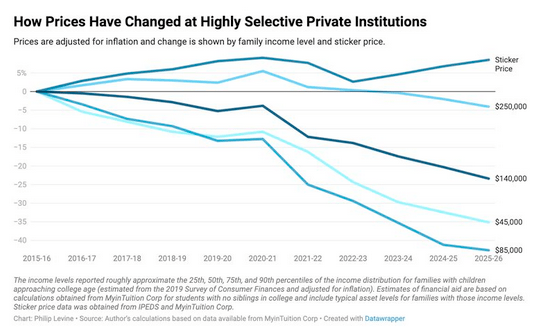
In the day to day it can be hard to remember that US college costs have actually been decreasing. And, at least at highly selective private institutions, that decrease varies quite a lot by parents’ income.
And yet, despite all of this, our systems are not adapting in response to either of these shifts.
Designed for the “Average” Student
According to the New York Times.
Today, if a woman in the United States gets into the driver’s seat of most cars, she is 73 percent more likely than a male driver to be severely injured if the car crashes. She is also 17 percent more likely to die. Fatality and injury risks are also higher for older adults, heavier adults and children than it is for young to middle-aged men who weigh around 170 pounds.
The reason: car safety features are designed around crash test dummies modeled on young to middle age men weighing 170 lbs.
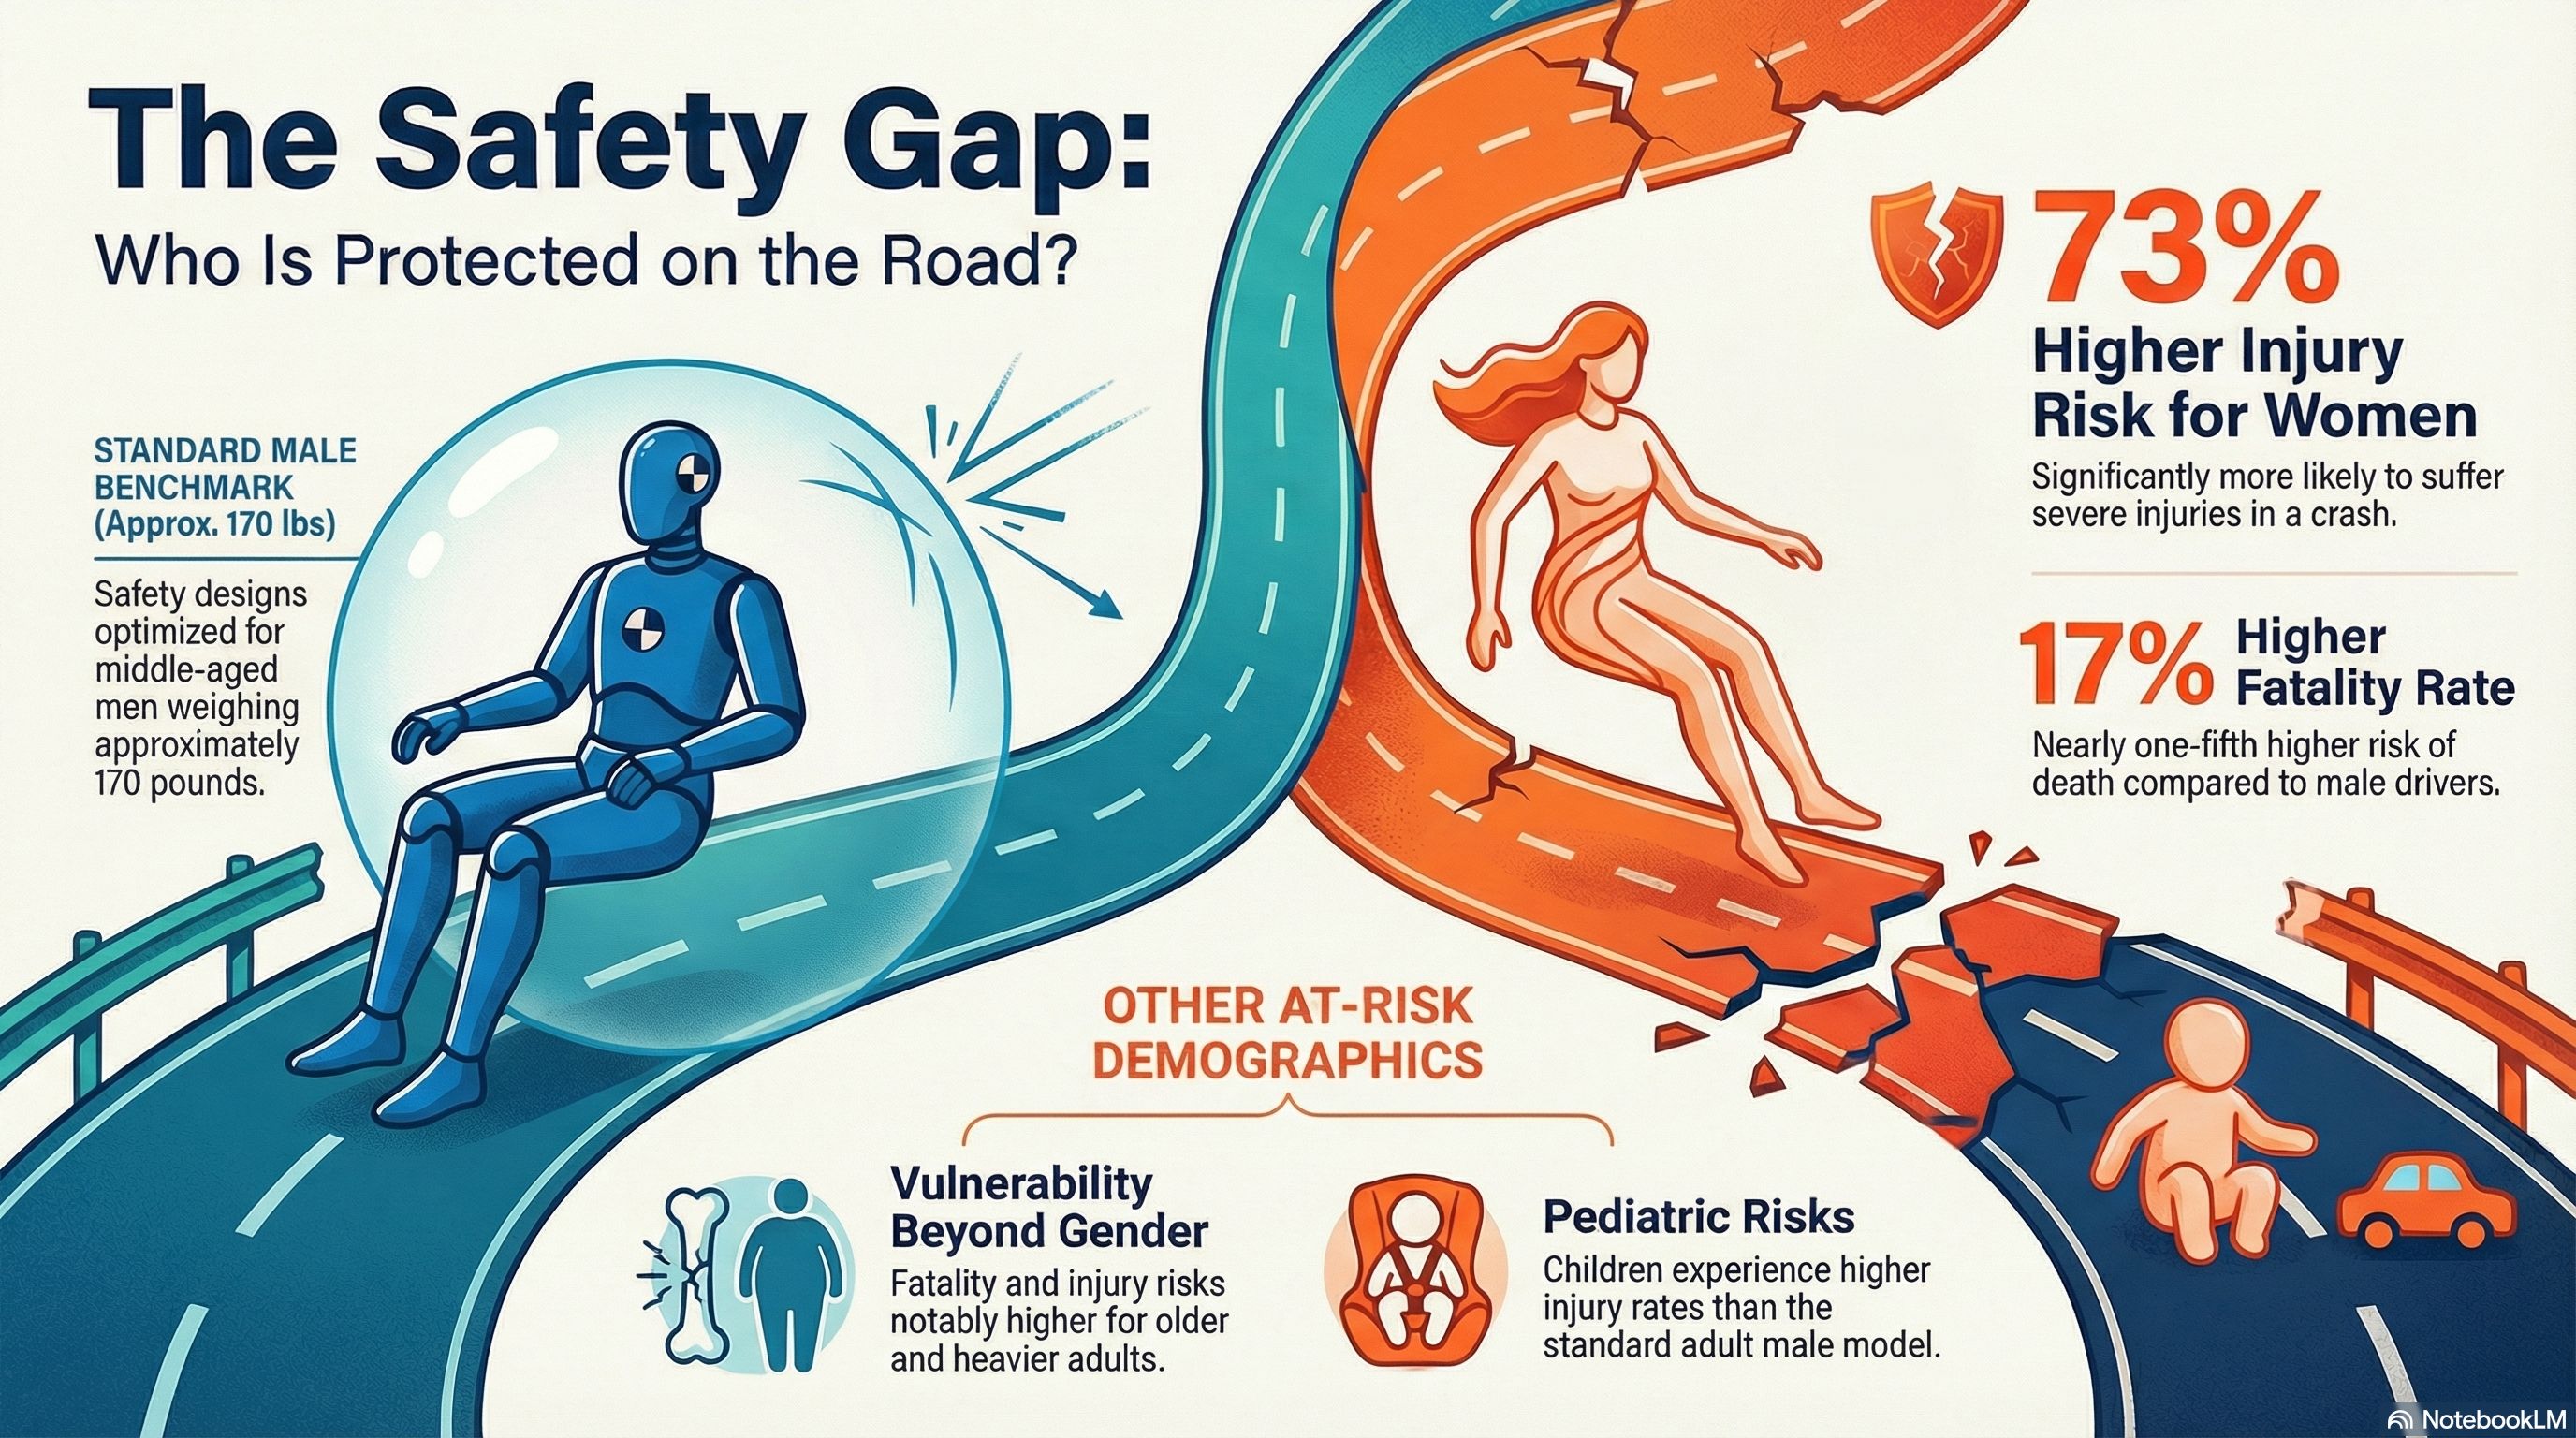
Adapted from the New York Times
This is what happens when you design for a “default” user that doesn’t reflect reality. We do the same thing in student success. We often establish baselines around a specific type of student. These averages don’t just “fail to work” for many students. They actively mislead us about where the real problems are and who is most at risk.
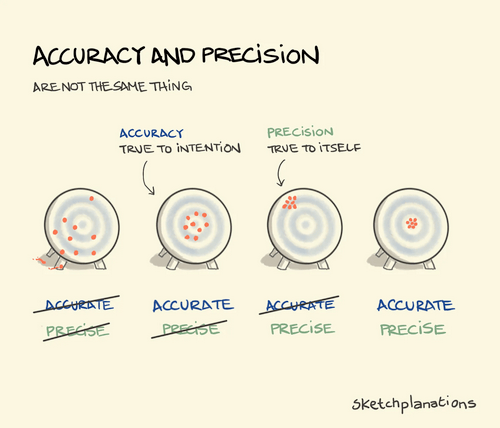
And when we measure, we often confuse precision with accuracy. Both are important concepts in data analytics and student success, but in many cases we are becoming more precise about the wrong things. From the incomparable Jono Hey.
Put these together, and the picture is clear. Students are changing. The environment is changing. But we are still designing systems and measures for a world that no longer exists.
We are often precise about the wrong things and less accurate about what matters. And then we call for more data.
The main On Student Success newsletter is free to share in part or in whole. All we ask is attribution.
Thanks for being a subscriber.