- On Student Success
- Posts
- Engines of Equity and the Geography of Access
Engines of Equity and the Geography of Access
Measuring how higher education creates opportunity
Glenda Morgan
October 08, 2025

Was this forwarded to you by a friend? Sign up for the On Student Success newsletter and get your own copy of the news that matters sent to your inbox every week.
I’m fascinated by the geographies of access in higher education—how proximity to colleges and universities shapes opportunity, especially for low-income students. Recently in my This Week in Student Success (TWISS) post, I highlighted a study showing how access to arts and humanities in the U.K. is being eroded. Last year, I covered strong reporting on shrinking higher-ed access in rural Texas.
This week, I take a longer, more detailed look at an excellent paper by Becca Spindel Bassett showing that access to universities that admit large numbers of low-income students and help them succeed is unevenly distributed across space.
I argue that Becca’s study is a valuable way to think about institutions and geographies of access, but it’s limited in two important ways: it focuses on on-campus programs without considering how online learning reshapes access, and it relies heavily on Pell eligibility as a proxy for socioeconomic status and graduation as a proxy for equity gains or upward SES movement. Both proxies are useful but incomplete. Incorporating post-graduation earnings and mobility metrics (e.g., movement across income quintiles) would better capture equity effects, and would likely expand the set of institutions that function as true “engines of equity.”
A quick note on style: when I name authors of studies, I generally use first names. This isn’t feigned familiarity; it’s simply that using surnames alone makes me sound like the rugby coaches at the boys’ boarding schools (I attended the girls’ equivalent and played field hockey and rowed crew) where I did my primary and secondary education, circa 1972–1984. On to the article.
Engines of equity
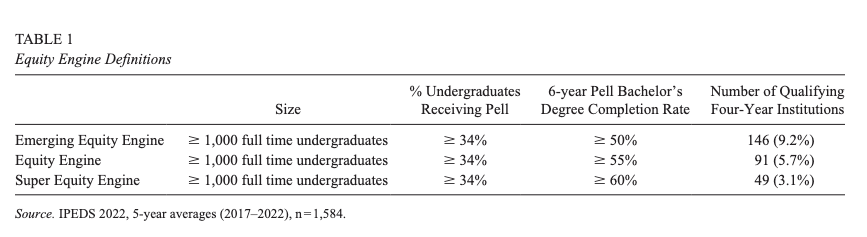
Core to Becca’s argument is the designation of certain higher education institutions as Equity Engines (EEs). To qualify as an Equity Engine, an institution must meet two criteria:
Access: Enroll a substantial share of Pell-eligible students. (For readers outside the US, Pell eligibility is a common proxy for low-income status. Pell Grants cover part of tuition and fees for undergraduates with exceptional financial need.)
Outcomes: Exceed the national six-year Pell graduation rate by at least 5 percentage points, i.e., achieve ≥55% completion for Pell recipients.
Becca further distinguishes institutions that significantly outperform these thresholds as Super Equity Engines (SEE’s) (I might have said “turbo”), and those just shy of the mark as Emerging Equity Engines (EEE’s).
All calculations use five-year averages, and the analysis is limited to institutions with at least 1,000 full-time undergraduates.
Her categorization is summarized in the table below.
Location, distance, and need
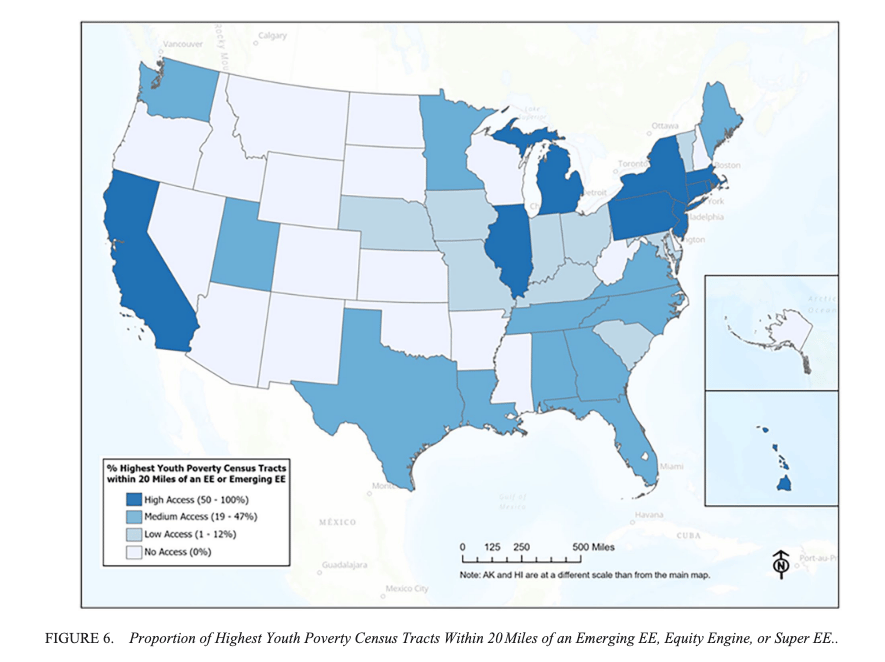
Twenty-four states have no Equity Engines or Super Equity Engines within their borders. When the threshold is lowered to include Emerging Equity Engines, five states gain at least one (Maine, Nebraska, Rhode Island, Vermont, and South Carolina). That still leaves nineteen states without any EEs, including four with some of the highest youth poverty rates: Mississippi, Arkansas, Oklahoma, and New Mexico.
I’m especially interested in Becca’s analysis of distance.
To estimate how many low-income students in a state have access to an EE, Becca divided census tracts into quartiles by child poverty. She then identified each tract’s geographic center and calculated the distance from that point to the nearest EE, Super EE, or Emerging EE. Finally, she computed the percentage of high-poverty tracts within 20 miles of an EE in each state. The 20-mile cutoff is grounded in prior research showing that low-income and first-generation students typically attend college within 10–20 miles of home.
The results reveal wide variation in close access to an EE across states.
Unsurprisingly, very small states with at least one EE, Super EE, or Emerging EE score very high on this measure of access. In Rhode Island and DC, 100% of the highest youth poverty census tracts are within 20 miles of an EE or Emerging EE. However, the other states that achieve top access rates are far larger: California (75%), New York (83%), Illinois (59%), and Michigan (54%). New York, New Jersey, California, and Illinois stand out as states that not only achieve high rates of access but also high proximity.
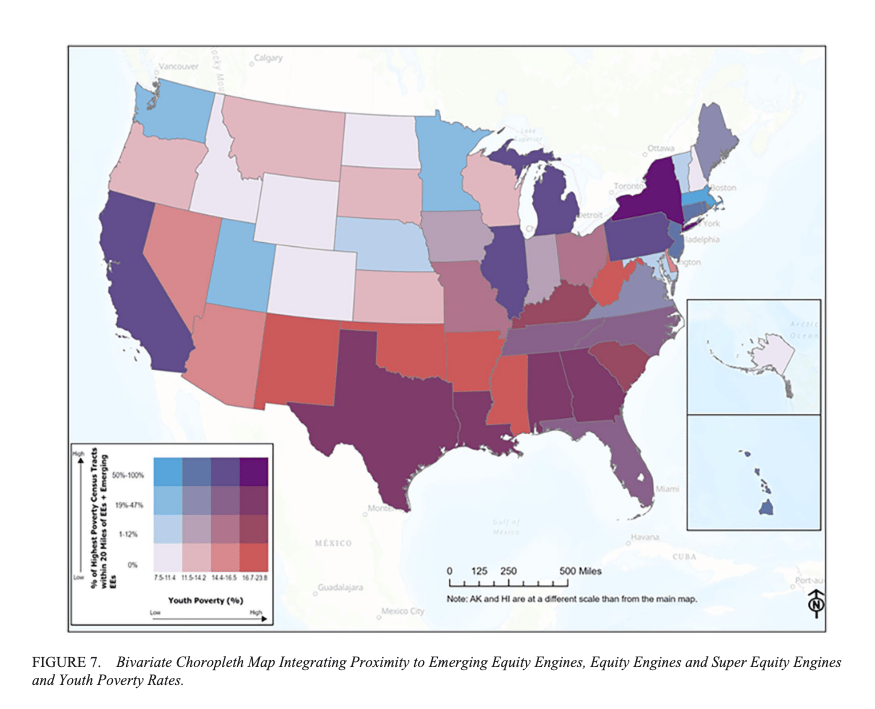
Next, Becca adds another dimension: need, measured by youth poverty rates.
The color scheme shows which states pair high poverty with high access (good alignment) versus high poverty with low access (a mismatch). This reveals that some states that looked strong in Figure 6 lose ground once need is considered. For example, North Carolina has several EEs, but they’re clustered in the western part of the state, leaving many high-poverty areas far from an EE.
Conversely, New York stands out for combining high need and high proximity: most of its poorest communities are near EEs, and a large share of its Pell students attend them. Texas, Alabama, and Georgia also perform relatively well on this alignment measure.
I love the ambition and methodological rigor of Becca’s analysis, but I think it has several blind spots that limit its usefulness in helping us understand access in today’s higher education landscape.
Online is an Engine of Equity too
The analysis is premised on students attending on-campus programs. Becca is somewhat dismissive of the importance of online learning, arguing that.
Place matters greatly in determining college opportunity [snip] While distance education has grown and most college students take at least one class online, less than 6% of full-time undergraduates are enrolled in a fully online program
The data she cites are dated—really dated (2015–2016). They are so old that they are now completely wrong. Online learning has changed dramatically since 2015-2016, both in enrollment and in maturity. More recent figures show that about 29% of undergraduates are enrolled exclusively online. Beyond the numbers, institutional acceptance, program quality, and student expectations have all evolved. It’s a different world now.
Online study is an important pathway for low-income students to access higher education, and excluding it limits the power of this analysis. That said, two caveats matter when we think about online as an access solution:
Most online students still live near the institutions they attend, so the proximity effect may not shift as much as we might expect, though patterns are changing.
Prior surveys (e.g., Wiley’s Voice of the Online Learner, 2019) suggest students increasingly choose nearby providers even for online programs, reinforcing the local pull of brand, cost, and support.
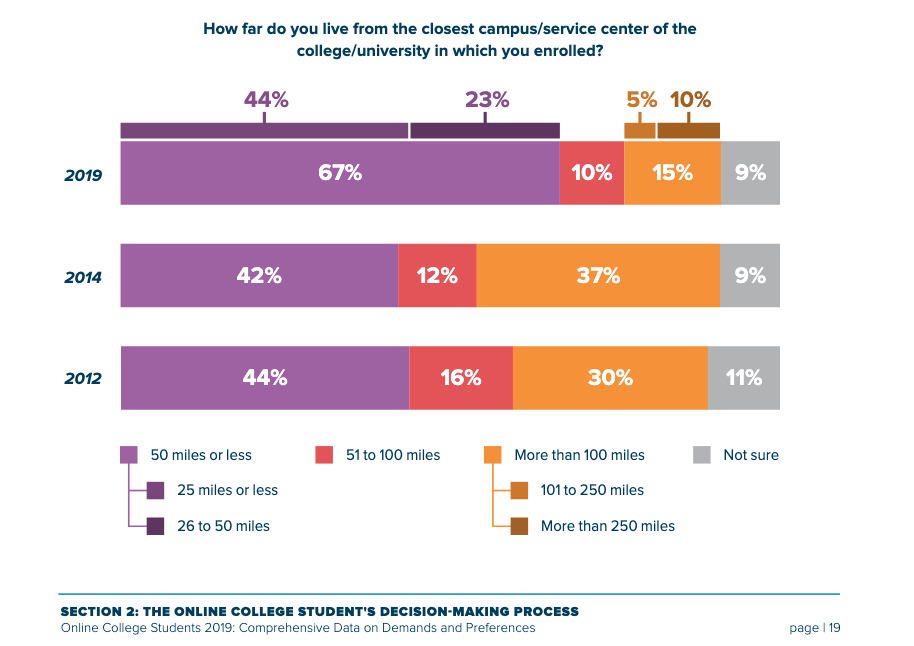
a growing majority of online students are choosing a nearby school. Since the first edition of this report in 2012, the distance between a student’s home and school has steadily contracted. During the past five years, the number of online students choosing a school within 50 miles of home grew from 42% to 67%. At the same time, the portion of students choosing a school more than 100 miles from home fell from 37% to 15%.
But the 2024 report (now from Risepoint) showed that students had begun to look further afield for programs.
Geographical proximity continues to be a factor in decision making, and it remains important for most students to be able to pursue programs from schools within their state, but the actual physical proximity to campus is less important than it has been in years past, driven by a decreasing appetite for campus-based learning.
A strong 70% live and/or work in the same state as their school, but the percentage who live within 100 miles of campus decreased significantly, from 70% last year to 57% this year.
Some of this shift is driven by the rise of national online brands such as SNHU, WGU, and ASU.
Second, we should acknowledge that online programs often show weaker student outcomes than on-campus programs, and they may not always be well suited to low-income students who arrive less well prepared.
Incorporating online learning into measures of access would also complicate the methodology, even before adding another dimension of distance. Graduation rates would need adjustment for part-time enrollment, and comparisons would have to account for differences in pacing, stop-outs, and student demographics.
Graduation is only part of success, and Pell-eligibility is a poor proxy for being low income
A core limitation of the paper is its reliance on certain indicators while excluding others, especially cost and post-graduation earnings. The use of graduation rates as a proxy for success and equity is particularly problematic. Completion is necessary, but it is not sufficient to show that an institution functions as an “equity engine.” A more rigorous approach would pair completion with post-graduation outcomes, especially earnings and inter-generational mobility. For example, Raj Chetty’s work links institutional attendance to movement up the income distribution (e.g., the share of students from the bottom 20% of income who move at least two quintiles up in income level), revealing that many colleges confer credentials but not life-changing opportunities.
Incorporating Raj Chetty’s data, or measures such as median earnings , debt-to-earnings ratios and repayment rates, and underemployment, would better capture whether graduates realize equitable economic returns, and whether institutions are reducing rather than reproducing equity.
The Pell proxy problem
Similarly, Pell eligibility is an imperfect proxy for low socioeconomic status. Raj Chetty’s data show that many institutions enroll substantial numbers of low-income students who are not necessarily Pell recipients. Reasons vary: some students do not apply for Pell; others do not qualify despite low household resources (due to assets, dependency status, documentation, timing, etc.). Relying on Pell alone obscures the true income mix and can misclassify institutional access.
There is also notable variation among institutions classified as Equity Engines in the paper. Some enroll relatively small proportions of low-income students compared to peers in the same state—raising questions about whether they genuinely function as engines of equity.
For instance, it is puzzling that Brigham Young University is classified as an Equity Engine while only 1.8% of its students come from the bottom income quintile. Other Utah institutions enroll higher proportions of low-income students, e.g., Weber State (4.4%), Southern Utah (5.1%), and Utah Valley (5.7%). Even the University of Utah enrolls 4.5% from the lowest quintile. These disparities suggest the classification may be overly sensitive to graduation rates and Pell metrics, and insufficiently attentive to who gains access.
Expanding the definition
If, instead of relying primarily on Pell and graduation rates, we incorporate Raj Chetty’s measures, both the share of students from the bottom income quartile and the probability of moving up at least two income quintiles after graduation, we identify additional potential engines of equity, including in some states the paper characterizes as under-resourced.
I’ve identified a handful of such institutions already and am happy to provide a longer list if readers are interested.
Institution | % of students in bottom 20% of income (from Raj Chetty | % likely to move at least two quintiles up in income level (from Raj Chetty) | 6 year graduation rates (from IPEDS) |
|---|---|---|---|
Jackson State University (Mississippi) | 24% | 36% | 32% |
Mississippi Valley State | 37% | 33% | 32% |
Glenville State University (WV) | 17% | 25% | 35% |
New Mexico State University | 19% | 25% | 52% |
Southern Arkansas University | 20% | 26% | 46% |
St Thomas University (FL) | 21% | 38% | 43% |
Southwestern Oklahoma State | 11% | 27% | 35% |
Many more institutions serve low-income students and help them improve their socioeconomic status than the paper recognizes. The binding constraint, however, is graduation: low completion rates slow the pace at which students’ lives can improve.
The central task, then, is improving student success, raising persistence and completion so more students at these institutions actually cross the finish line.
Parting thought
At one point in Pride and Prejudice, Mr. Bennet says of Mr. Darcy that he can hardly look at a woman without finding a blemish. I sometimes feel like the EdTech-and–student-success newsletter equivalent of Darcy, unable to read a report without picking it apart.
But that’s how the field moves forward. We learn from studies and practices, recognize their shortcomings, and design something better. Critique isn’t cynicism; it’s how we improve the work and, ultimately, student outcomes.
The main On Student Success newsletter is free to share in part or in whole. All we ask is attribution.
Thanks for being a subscriber.